Node Group Health Report
Node Group Health Report
#388
This table reports on the operational status and performance of your node groups within your container environments. Container performance is impacted by its underlying infrastructure. Maintaining excess infrastructure results in wasted cloud spending.
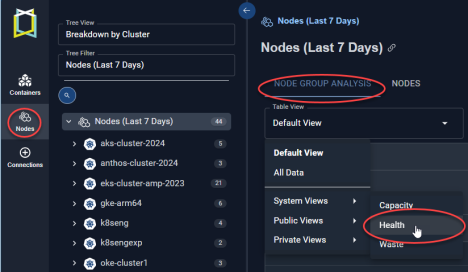
Figure: Locating the Node Group Health View
Customizing this Table
You can use the following options to customize the content of this table:
- Create filters at the column or table level. See Using Table Column Features.
- Enable or disable specific columns
- Drag column headers to Group By bar to organize date data for your specific use case.
Review the detailed health report in this table to optimize your node health.
|
Column Name |
Description |
|---|---|
|
Cluster |
The cluster name containing the node group. By default this table is sorted Cluster then Node Groups, in alphabetic order. |
|
Node Group |
The node group name. For nodes that do not belong to a node group, their node group value will be <cluster-name>-default”. |
|
Primary Node Type |
The most common instance type. For example, if there are 20 r6i.large instances and 10 m6i.large instances, the primary node type is r6i.large. In cases where the instance type cannot be determined (i.e. bare-metal, private cloud environments) the primary node type is indicated as: CPU x memory size, e.g.. 8x16. A dash (-) indicates that node instance details could not be determined. |
|
Unique Nodes |
The total number of unique nodes that are part of this node group, during the past 7 days of history. Node ID is used to determine if a node is unique. The number listed in this column is a hyperlink that takes you to the Nodes details tab. Only the systems, as indicated by the count in this table cell, are shown on the details page. See Nodes Tab. |
|
Average No. of Nodes |
The average number of nodes in the node group, during the past 7 days of history for in-service instances with non-zero workload. For clusters (i.e. <cluster-name>-default) that are composed of nodes that are not part of a node group, the average number of nodes is calculated as: Total Node Hours/Total Hours in time period (7 days). For example, if there are 20 nodes, that are not part of any node group, and in total there are 200 node hours of utilization, then: 200 node hours/168 hours in 7 days = 1.19 Avg number of nodes. |
|
Total Node Hours |
The cumulative number of hours that nodes have been up and running, with CPU or memory utilization. |
|
The number of nodes with peak CPU utilization above the saturation threshold (default: 95%), during the past 7 days of history. The saturation threshold value is configurable. Contact [email protected] for details. |
|
|
The percentage of nodes with peak CPU utilization above the configurable, saturation threshold (default: 0%) during the past 7 days of history. The value is expressed as a percentage of the total number of nodes. If the value exceeds the threshold the cell is shaded red. The saturation threshold value is configurable. Contact [email protected] for details. |
|
|
CPU - Node Balance Ratio |
The ratio of the busiest (top 10%) to least busy (bottom 10%) nodes within a node group. Use this value to assess the distribution of CPU resources across the nodes in a cluster. A value between 1 and 1.5 is ideal. If the ratio exceeds a value of 2 the cell is shaded to clearly indicate that resource allocation should be investigated. This threshold value is configurable. Contact [email protected] for details. |
|
The number of nodes with memory utilization above the saturation threshold, during the past 7 days of history. The saturation threshold value is configurable. Contact [email protected] for details. |
|
|
Nodes with Memory Saturation (%) |
The percentage of nodes with memory utilization above the configurable, saturation threshold (default: 0%) during the past 7 days of history. The value is expressed as a percentage of the total number of nodes. This is calculated as: Node hours with saturated memory/ total node hours. If the value exceeds the threshold the cell is shaded red. The saturation threshold value is configurable. Contact [email protected] for details. |
|
Memory - Node Balance Ratio |
The ratio of the busiest (top 10%) to least busy (bottom 10%) nodes within a node group. Use this value to assess the distribution of memory resources across the nodes in a cluster. A value of between 1 to 1.5 is ideal. If the ratio exceeds a value of 4 the cell is shaded to clearly indicated the resource allocation should be investigated. The threshold value is configurable. Contact for details. |
|
No. of Container Manifests |
The number of container manifests in the node group being analyzed during last analysis run. Only containers that were part of the selected node group AND not part of another node group, in the past 7 days, are counted. |
|
Container Manifests with Restarts - Last Day |
The number of container manifests in this node group with containers that were restarted in the last day. Only containers that were part of the selected node group AND not part of another node group, in the last day, are counted. |
|
Container Manifests with Memory Limit Events - Last Day |
The number of container manifests in the node group which have exceeded the working set memory limit, in the last day. |
|
Primary Node Type CPU (Cores) |
The total CPU allocation of the primary node/instance type. If a primary node has not been identified use, the value of capacity_cpu. |
|
Primary Node Type Memory (GB) |
The total memory allocation of the primary node/instance type. If a primary node has not been identified, use the value of capacity_mem, converted to GB. |
|
Total |
The totals at the bottom of the table indicate the total for each column, for all pages, if you have a multi-page report. Vertical scroll bars may be displayed to scroll through the entire list, so lower rows may be momentarily hidden behind the row of Totals. |
Please observe the following for this set of data:
- Missing data is indicated with a dash (-).
- Nodes that are not part of a node group, will be added to the node group "<cluster>-default".
See the following topics for more details: